An old saying derived from a Danish proverb goes, “It’s difficult to make predictions, especially about the future.” As difficult as predicting the future is, it’s common in business and especially important to marketing.
Because marketing is the part of business primarily responsible for generating revenue, forecasting the success of marketing activities has implications for virtually every other part of the business. Sales forecasts affect hiring, investments, salaries, purchasing, production, and just about anything else a business does.
Accurate forecasting gives businesses a distinct advantage over competitors who do not prepare forecasts or those who prepare them poorly. Accurate forecasts help businesses better allocate and, hopefully, earn more from their resources.
Apart from the difficulties of predicting the future generally, forecasting itself often evokes nervous reactions because the techniques can be very complex and mathematical.
However, not all forecasting needs to be so. Many forecasting methods rely solely on informed opinions, while some utilize relatively quantitative analyses. In these notes, we’ll overview several different approaches to forecasting.
Why Should You Measure Current Market Demand?
The marketing opportunities of a company are basically identified by conducting marketing research. After the research identifies opportunities, target markets should be selected very carefully, evaluating the identified opportunities.
To begin with, the management must measure and forecast the size, growth, and profit potential of each opportunity.
Several departments in the company use the sales forecasts for which finance, manufacturing, purchasing, and human resources departments are important. Each has its special interest in forecasts for sales.
For example, the manufacturing department uses it to establish capacity and output levels, purchasing needs it to acquire the appropriate amount of supply, human resources to hire the needed number of workers, and finance uses it to raise the needed cash for investment and operations. The marketing department prepares sales forecasts.
A company must make forecasts as real as possible to eliminate the problems of either stockpiling up or markets being underserved. In both of these situations, the company loses money.
Demand estimates are used as a basis for sales forecasts. It is necessary to define market demand very carefully.
Importance of Measuring Current Market Demand
Market demand measurement warrants a clear understanding of the market in question. The term market has assumed many meanings over time.
The market refers to a physical place where buyers and sellers gather to exchange goods and services. In medieval towns, there were market squares where sellers brought their goods, and buyers shopped for goods.
In today’s cities, buying and selling take place in shopping areas rather than markets. Economists think that a market describes all the buyers and sellers who transact over goods or services.
Thus, the laundry-soap market consists of sellers of soaps such as ‘WHEEL’ and ‘NIRALA”, and of all the buyers who buy laundry soaps.
To a marketer, a market is the set of all actual and potential product or service buyers. A market is the set of buyers, and the industry is the set of sellers.
The size of a market hinges on the number of buyers who might exist for a particular market offer. Potential buyers for a product or service have four characteristics: interest, income, access, and qualifications.
Let us consider the consumer market for Suzuki cars. To assess its market, Suzuki first must estimate the number of users who have a potential interest in owning a car.
To do this, the company might contact a random sample of users and ask the following question: “Do you have an interest in buying and owning a car?”
If one person out of twenty says yes, Suzuki might assume that 5 percent of the total number of users would constitute the potential market for cars.
Users’ interest alone is not sufficient to define the car market. Potential users must have adequate income to afford the product.
They must be able to answer yes to the question: “Can you afford to buy a car? The higher the price, the lower the number of people who can answer yes to this question. Thus, market size depends on both interest and income.
Other obstacles further reduce the car market size. For example, if Suzuki does not distribute its cars in certain less developed countries, potential users in those countries are not available as customers.
Or in some markets, sales might be restricted to certain groups. For example, some countries might ban the sale of cars to anyone under 18 years of age. In these areas, younger users would not qualify as Suzuki car customers.
Thus, Suzuki’s potential market consists of users with interests, income, access, and qualifications for cars.
Companies must be skillful in measuring current and future forecasting demand because knowledge about demand is of great importance to developing effective targeting strategies and managing marketing efforts effectively.
Overoptimistic estimates of current or future demand can lead to costly overcapacity or excess inventories. Again, underestimating demand can result in missed sales and profit opportunities.
Estimates of Market Demand
A company can make many different types of demand estimates or measurements. As Dr. Kotler identified, there are 90 different types of demand estimates that a company can make. The diagram on the next page shows this.
It can be measured for five different space levels, six different product levels, and three different time levels, and thus a company can have 90 types of demand estimates (5 x 6 x 3). Why a company goes for so many different types of demand measurement?
The answer is: that each serves a specific objective. To order raw materials, plan production, and borrow cash, a company may forecast a specific product’s short-run demand (time level).
Again, it may forecast regional demand for its major product line to decide whether to set up a regional distribution network.

Demand can be measured along several dimensions, as shown in the figure above.
With respect to the product level, demand can be estimated for specific product items (such as frozen orange juice) or for a product line (such as frozen foods). With respect to geographic level, demand can be measured for a neighborhood, town, district, division, or nation.
In relation to time, demand measurement can be short-range (one year or less), medium-range (one to five years), or long-range (longer than five years). If you make permutation and combination calculations using three different demand levels, you will come up with 90 different types of demand estimates.
Deciding on Which Market to Measure
Many different market terms are discussed in marketing literature, such as potential markets, available markets, served markets, and penetrated markets. It is imperative to understand the term ‘market‘ in its true perspective to understand these terms.
The market is a set of a product’s actual and potential buyers. This definition suggests that a particular product’s size depends on the number of people who may accept the offered product.
On the other hand, the potential market is the set of consumers who show sufficient interest in the product’s offer. The mere interest of people does not serve the purpose of marketers. People must have sufficient income to buy the product as well as access to the offer.
To have access to the product offered by a certain group of people, the product must be distributed or made available to the area where these people live. This gives rise to the concept of the available market.
It is the set of consumers who have interest, income, and access to a specific market offer. Every individual in the available market of a particular product may not qualify to buy it either because the company may discourage some of them or the law may restrict some from buying.
Individuals excluding the above-mentioned groups, qualify to buy the product that constitutes the qualified available market.
The company may decide to target a part of it or the whole available market from the qualified available market. If it decides to go for a part of the total qualified available market, it is called the target or served market.
There is no guarantee that everybody in the target market will buy the company’s product.
The set of customers who have already bought the company’s product is called the penetrated market. Understanding the above-market terms may help a company plan its market planning activities efficiently.
Demand Measurement – Useful Vocabulary
You should be familiar with two major concepts in demand measurement: total market demand and company demand. Here we shall take up a discussion on these two concepts at some length :
Total Market Demand
Philip Kotler defines total market demand for a product as the total volume that a defined consumer group would buy in a defined geographical area in a defined time period in a defined marketing environment under a defined level and mix of industry marketing effort.
Total Market Potential
Should all other market factors remain unchanged (time period, geographical area, economic conditions, and so forth). At the same time, each competitor makes a maximum marketing effort, and we can estimate a total market potential – the total possible sales of the product by all competitors.
The total market potential is rarely realized or sought. The additional expenditures necessary to reach marginally interested buyers would be very likely to lower the profits on such sales (between estimated demand and total market potential) to an unattractive level.
Using the following formula, the total market potential may be measured:
| Q = nqp; where: Q = total market potential n = number of buyers in the specific product/market under the given assumptions q = quantity purchased by an average buyer p = price of an average unit |
Company Demand
Company demand is the company’s estimated share of market demand at alternative levels of company marketing effort. Company demand for a particular company may be shown symbolically as Qi = siQ
| Qi = siQ Where: Qi = company i’s demand si = company i’s market share Q = total market demand |
People’s perception of several things relative to the competitors determines a company’s market demand. They are the product itself, services offered by the company, prices, communications, etc.
Company Sales Forecast
A company sales forecast represents realistic expectations of a company’s sales of a particular product or product line to the chosen target market, over a specified time, in a chosen geographic area, and under a defined marketing program.
Forecasts are basically the projections used to formulate action plans for the implementation of marketing strategies. These forecasts are most often short-term and quite specific.
Marketing managers and statisticians have developed several techniques for making sales forecasts. About the company sales forecast, you should be familiar with two other relevant concepts. They are sales quota and sales budget. Let us now define them.
Philip Kotler defines a sales quota as the sales goal set for a product line, company division, or sales representative.
To define and stimulate sales effort, managements use sales quota as a device. Based on sales forecasts, management sales quota by adding a percentage to it to stretch the sales force to put in some extra effort.
On the other hand, a sales budget is defined as a conservative estimate of the expected volume of sales. It is used primarily for making current purchasing, production, and cash-flow decisions. The usual practice is to set sales budgets slightly lower than the sales forecasts.
Company Sales Potential
Company sales potential may be defined as the sales limit approached by company demand as company marketing effort increases relative to competitors. A company’s sales potential may be equal to the company’s market potential if it can achieve a cent percent of the market.
Methods of Estimating Current Market Demand
There are several methods of estimating current demand;
- Estimating Total Market Demand
- Estimation of Area Market Potential,
- Estimation of industry sales and market shares.
Hence, the estimation of total market potential is discussed before, and we will focus here on the estimation of area market potential and estimation of industry sales and market shares.
Estimation of Area Market Potential
Characteristics of the market vary from area to area. And in order to be successful, a company needs to pursue different strategies in different areas. To decide on strategies, a company needs to estimate market potential area-wise. There are two methods available to estimate area market potential;
Market-buildup Method
In this method, the potential buyers in a particular area are identified first, and then potential purchases by them are estimated. But it is very difficult to identify potential buyers, particularly in a country like Bangladesh, Nigeria, or India, and hence the use of this method here is very uncommon.
Multiple-factor Index Method
This method measures market potential along with different factors such as population, per capita income, age, gender, and so on.
For each factor, a specific weight is assigned, and the marketing manager estimates the market potential of a particular area by taking into account the factors and their corresponding weights.
Estimation of Industry Sales And Market Shares
To estimate industry sales and market shares, a company first identifies its competitors and then estimates sales of them. The sum of competitors’ sales estimates and that of the company constitute industry sales.
It helps a company to assess its performance with that of the industry average. Here, a company may take help from publications of different trade associations as well as reports of different research organizations.
Measuring Current Market Demand
We will now discuss some practical methods for estimating current market demand. In practice, there are three aspects to estimate current market demand.
These are total market demand, area market demand, and actual sales and market shares.
1. Estimating Total Market Demand
The total market demand for a product or service is the total volume that would be bought by a defined consumer group in a defined geographic area in defined time in a defined marketing environment under a defined level and mix of industry marketing effort.
Total market demand is not a fixed number but a function of the stated conditions.
For example, next year’s total market demand for ice cream in Canada will depend on how much the makers of Sealtest, Haagen-Dazs, Parlour, President’s Choice, and other brands spend on marketing.
It will also depend on many environmental factors, ranging from the level of consumer health concerns to the weather in key market areas. The demand for premium ice-cream brands will be affected by economic conditions.
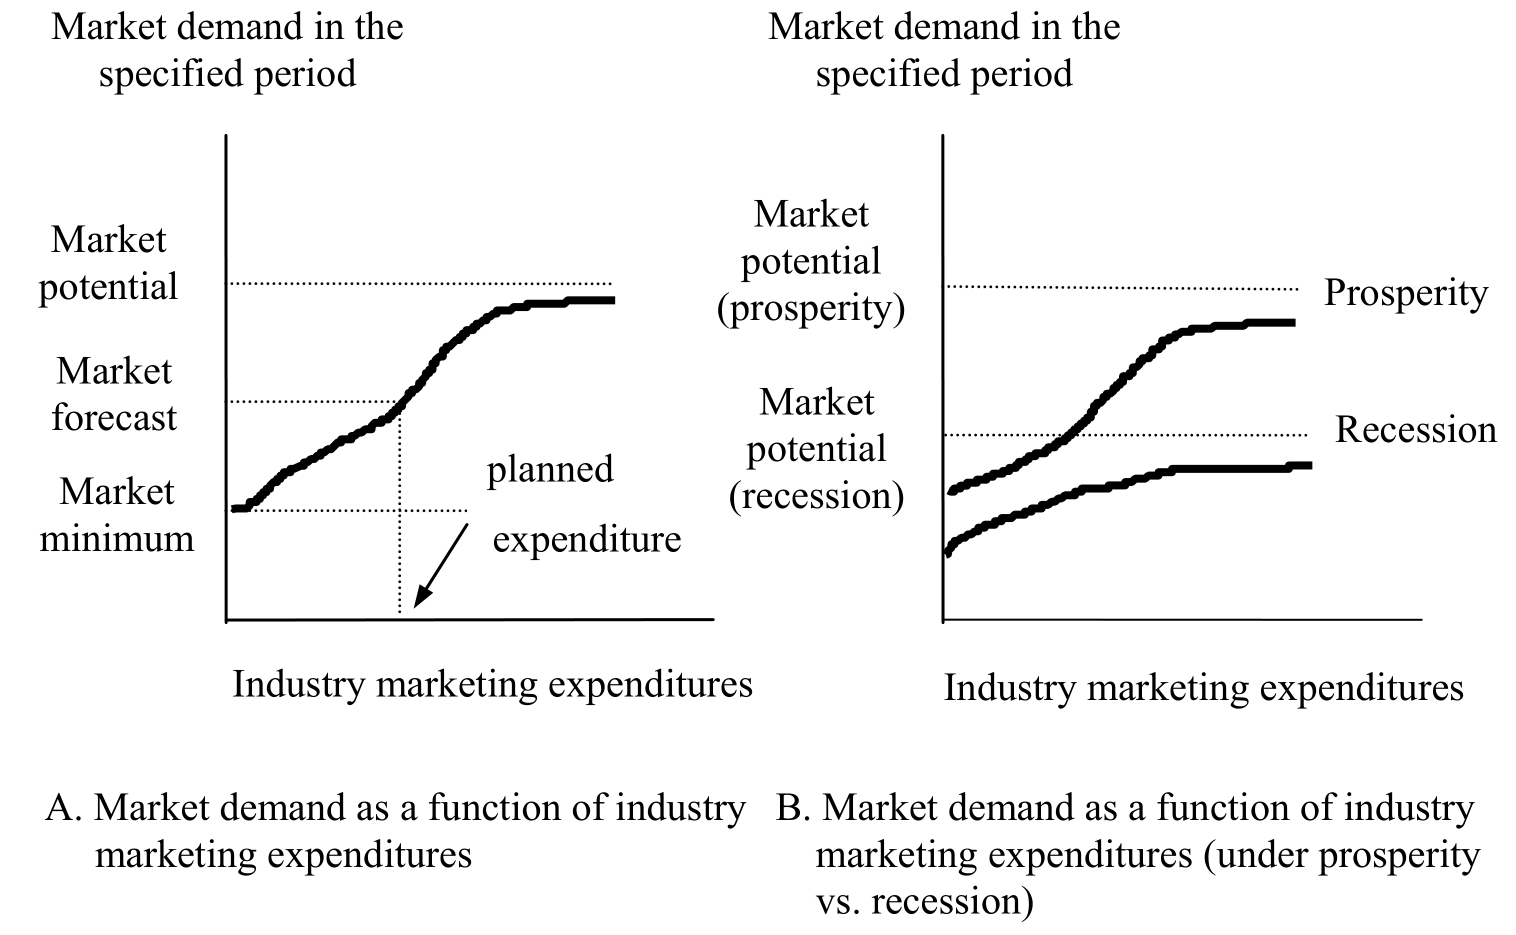
The figure shows the relationship between total market demand and various market conditions. The horizontal axis shows different possible levels of industry marketing expenditures in a given period.
The vertical axis shows the resulting demand level. The curve shows the estimated level of market demand at varying levels of industry marketing effort. Some minimum level of sales would occur without any marketing expenditures.
Greater marketing expenditures would yield higher levels of demand, first at an increasing rate, and then at a decreasing rate. Marketing efforts above a certain level would not cause much more demand.
This upper limit of market demand is called market potential. The industry market forecast shows the expected level of market demand corresponding to the planned level of industry marketing effort in the given environment.
Companies selling in mature, non-expandable markets often take primary demand—total demand for all brands of a given product or service—as given. They concentrate their marketing resources on building selective demand—demand for their brand of the product or service.
For example, in North America, where it faces a mature and largely non-expandable total soft drink market, Coca-Cola directs most of its marketing energies toward building consumer preference for Coke, Diet Coke, Sprite, and its other brands.
However, in countries such as China or Russia, which are characterized by huge but largely untapped market potential, Coca-Cola attempts to build the primary demand for soft drinks, as well as preference for its brands.
Companies have developed various practical methods for estimating total market demand. We will illustrate two here. Suppose Warner Communications Company wants to estimate the total annual sales of recorded compact discs.
A common way to estimate total market demand is as follows:
| Q = n X q X p Here; Q = total market demand. n = number of buyers in the market. q = quantity purchased by an average buyer per year. p = price of an average unit. |
Thus, if there are 100 million buyers of compact discs each year, the average buyer buys six discs a year, and the average price is $17, then the total market demand for discs is $10.2 billion (= 100 000 000 X 6 X $17).
A variation of this approach is the chain ratio method. This method involves multiplying a base number by a chain of adjusting percentages.
For example, suppose Thompson Consumer Electronics (TCE) wants to estimate the market potential for its new RCA Digital Satellite System. This system uses a small 18-inch wide home satellite dish mounted on a rooftop, windowsill, or porch railing to receive digital television signals relayed from two high-power satellites in space.
System prices start at $975 for the satellite dish, decoder box, and remote control. Customers can subscribe to more than 150 channels, all with crystal-clear digital quality pictures and CD-quality sound.
Initially, TCE will target households in small towns and rural areas where cable TV is limited or lacking. TCE can make a Canadian demand estimate for the RCA Digital Satellite System using a chain of calculations like the following:
The total number of Canadian households:
- The percentage of Canadian households located in small towns and rural areas not served well by cable television
- The percentage of these small towns and rural households with moderate or heavy television usage
- The percentage of moderate or heavy usage households with enough discretionary income to buy RCA’s home satellite dish
This simple chain of calculations would provide only a rough estimate of potential demand. However, more detailed chains involving additional segments and other qualifying factors would yield more accurate and refined estimates.
Chain Ratio Method of Calculating Market Potential
The chain ratio method kind of assumes that what happens for one market will happen proportionally in another market. So if we have information on sales or market share in one market, we can extrapolate those results to another market.
One common application of the chain ratio method is where a local or regional company wants to calculate potential sales nationally. In this case, the chain ratio method would follow several steps.
First, identify the demographic characteristics of the customer groups to whom the analysis applies. Because the chain ratio method relies heavily on secondary data, often population data from the Census Bureau, it’s best to describe markets in terms of sex, age, and income.
Although we may use more complex demographic descriptions for other purposes, data for the chain ratio method will be more available, timely, and accurate if the demographic description is kept simple.
Sometimes data giving estimates of population size by occupation and some psychographic variables are available. If the data are available and reliable, then they can be used. If not, keep the market description simple.
For example, suppose a brand of expensive upscale cookware produced in California sells primarily to women between the ages of thirty-five and sixty-four with household incomes above $75,000 annually. This demographic group is simply defined and does not include extra variables such as marital status, family size, education, or occupation. Suppose the company sells through retailers up and down the West Coast.
Second, estimate how many current customers your brand has in the target demographic group. If the group is relatively new, the estimate may be more tenuous.
If your company is seeking to sell to the same demographic group but in another area, then the information ought to be easy find internally.
For example, suppose the upscale cookware company had ten thousand purchases by people in that demographic group.
How does the company get access to that kind of information? Well, it could survey its dealers or distributors if it uses traditional retail channels. If it uses primarily online distribution, it could survey purchasers as they buy.
Or it could rely on syndicated survey or panel data provided by a commercial marketing research provider. No matter what the source, every company with even a modestly sophisticated understanding of its customers ought to have access to information that describes its customers.
Third, divide total sales of your brand to members of the target demographic and then divide by the number of customers in the target demographic to obtain the sales per customer.
For example, suppose that the company estimated that it sold five million dollars’ worth of cookware to the target demographic group. Assuming that the ten thousand purchases were made by separate individuals, the company would estimate the average purchase per customer to be $500 (5,000,000 10,000).
Fourth, estimate the number of people in the target group that live in the area to which your brand plans to expand and then multiply that number of people by the average sales per customer in that group calculated in the previous step.
For example, suppose the cookware company wants to expand into Arizona, Utah, and Colorado. Using Census Bureau data, the company learns that in these three states there are approximately 406,000 women between thirty-five and sixty-four living in households with annual incomes above $75,000. The market potential calculation is very straightforward.
Multiply the population of the target audience in the new location by the amount spent per year by current customers of the same demographic description.
Thus, 406,000 x 500 = $203,000,000.
To emphasize again, this figure is not the sales forecast; it is not a prediction of what they will sell. The market potential estimate is the amount that could possibly be sold if all members of the target audience decided to buy. The main advantage of the chain ratio method is its simplicity.
The data are usually readily available, and mathematics are not complicated at all. The biggest drawback to using the chain ratio method is its main underlying assumptions, which is that the same average purchase rate will hold from one area to another.
Of course, companies have little way of knowing that. However, having an empirically based estimate as a starting point for market expansion planning is better than simply making those decisions from intuition alone.
2. Estimating Area Market Demand
Companies have to select the best sales territories and must allocate their marketing budget optimally among these territories. For this purpose, they must estimate the market potential of different cities, states, and countries.
Two major methods are used for estimating area market demand – the market-buildup method and the market-factor index method.
The market-buildup method is used mainly by business goods firms, and the market-factor index method is used mainly by consumer goods firms.
Market-Buildup Method
The market-buildup method calls for identifying all the potential buyers in each market and estimating their potential purchases. Suppose a manufacturer of mining instruments developed an instrument that can be used in the field to test the actual proportion of gold content in gold-bearing ores.
By using it, miners would not waste their time digging deposits of ore containing too little gold to be commercially profitable. The manufacturer wants to price the instrument at $ 1,000.
It expects each mine to buy one or more instruments, depending on the mine’s size. The company wants to determine the market potential for this instrument in each mining state. It would hire a salesperson to cover each state that has a market potential of over $300,000. The company wants to start by finding the market potential in Colorado.
To estimate the market potential in Colorado, the manufacturer can consult the Standard Industrial Classification (SIC) developed by the U.S. Bureau of the Census.
The SIC is the government’s coding system that classifies industries, for purposes of data collection and reporting, according to the product produced or operation performed. Each major industrial group is assigned a two-digit code.
Suppose the metal mining bears code number 10. Within metal mining, there are further breakdowns into three-digit SIC numbers (the gold and silver ores category has the code number 104).
Finally, gold and silver ores are subdivided into further SIC groups with four-digit code numbers (lode gold is 1042, and placer gold is 1043). Our manufacturer is interested in gold mines that mine both lode deposits (those mined from underground) and placer deposits (those mined by dredging or washing).
Next, the manufacturer can turn to the Census of Mining to determine the number of gold-mining operations in each state, their locations within the state, and the number of employees, annual sales, and net worth.
Using the data on Colorado, the company prepares the market potential estimate shown in Table below. Column 1 classifies mines into three groups based on the number of employees. Column 2 shows the number of mines in each group.
| Market-Buildup Method Using SIC: Instrument Market Potential in Colorado | |||||
| SIC | (1) Number of employees | (2) Number of mines | (3) Potential number of instruments per size class | (4) Unit market potential (2×3) | (5) Dollar market potential (at $ 1,000 each) |
| 1042 | Under 10 | 80 | 1 | 80 | |
| (lode deposits) | 10 to 50 | 50 | 2 | 100 | |
| Over 50 | 20 | 4 | 80 | ||
| 150 | 260 | $ 260,000 | |||
| 1043 | Under 10 | 40 | 1 | 40 | |
| (placer deposits, | 10 to 50 | 20 | 2 | 40 | |
| Over 50 | 10 | 3 | 30 | ||
| 70 | 110 | $ 110,000 | |||
| $ 370,000 | |||||
Column 3 shows the potential number of instruments that mines in each size class might buy. Column 4 shows the unit market potential (column 2 times column 3).
Finally, column 5 shows the dollar market potential, given that each instrument sells for $1,000. Colorado has a market potential of $ 370,000.
Therefore, the mining instrument manufacturer should hire one salesperson for Colorado. In the same way, companies in other industries can use the marketbuildup method to estimate market potential in specific market areas.
Market-Factor Index Method
Consumer goods companies also have to estimate the area’s market potential.
Consider the following example: A manufacturer of men’s dress shirts wishes to evaluate its sales performance relative to market potential in several major market areas, starting with Vancouver.
It estimates the total national potential for dress shirts at about $200 million per year. The company’s current nationwide sales are $14 million, about a seven percent share of the total potential market.
Its sales in the Vancouver metropolitan area are $1 200 000. It wants to know whether its share of the Vancouver market is higher or lower than its national seven percent market share.
To determine this, the company first needs to calculate market potential in the Vancouver area.
A common method for calculating area market potential is the market-factor index method, which identifies market factors that correlate with market potential and combines them into a weighted index.
An excellent example of this method is called the market rating index, which is published each year by The Financial Post in its Canadian Markets publication.
This survey estimates the market rating for each province and metropolitan area of Canada. The market rating index is based on two factors: the area’s share of Canada’s population and retail sales. The market rating index (MRI) for a specific area is given by
MRI = percentage of national retail sales in the area/percentage of the national population in the area.
Using this index, the shirt manufacturer looks up the Vancouver metropolitan area and finds that this market has 5.77 percent of the nation’s population and 7.03 percent of the nation’s retail sales. Thus, the market rating index for Vancouver is
MRI = 7.03/5.77 = 122
Vancouver has a market rating index that is 22 percent higher than the national average. Because the total national potential is $200 million nationally each year, total potential in Vancouver equals $200 million x 1.22 x .0577 = $14 078 000. Thus, the company’s sales in Vancouver of $1 200 000 amount to a $1 200 000 -4- $14 078 800 = 8.5 percent share of area market potential.
Comparing this with its seven percent national share, the company appears to be doing better in Vancouver than in other areas of Canada.
The weights used in the buying power index are somewhat arbitrary. They apply mainly to consumer goods that are neither low-priced staples nor high-priced luxury goods.
Other weights can be used. Also, the manufacturer would want to adjust the market potential for additional factors, such as the level of competition in the market, local promotion costs, seasonal changes in demand, and unique local market characteristics.
Many companies compute additional area demand measures. Marketers can now refine province-by-province and city-by-city measures down to census tracts or postal codes.
Census tracts are small areas about the size of a neighborhood, and postal code areas (designated by Canada Post) can be used to identify particular streets, neighborhoods, or communities within larger cities.
Buying Power Index
We begin with the simplest method for estimating market potential, excluding just guessing. The Buying Power Index, or BPI, was initially developed by the Sales and Marketing Management magazine.
The index is very easily calculated with readily available data and is intended to help marketers compare the retail purchasing power of specific locations in the United States.
The BPI is not specific to any product or product category. It simply gives a comparative measure of consumer purchasing power relative to purchasing power nationwide. To understand the BPI, let’s begin with its formula.
BPI = 0.2 (% of U. S. Population in Area) + 0.3 (% of U. S. Retail Sales in Area)
+ 0.5(% of U. S. Disposable Income in Area)
You can see by looking at the formula that it is a weighted sum that describes an area’s purchasing power relative to the United States.
To measure market potential, BPIs can be calculated for several areas of similar size or population, and then they can be compared to each other. Again, BPI is not specific to any particular product; it describes a given geographic region.
Data to calculate the BPI are readily available from the Census Bureau and from the Bureau of Economic Analysis. BPI figures are most frequently calculated for metropolitan areas generally at the county level.
3. Estimating Actual Sales and Market Shares
In addition to estimating total and area demand, a company is also interested to know the actual industry sales in its market. So, it needs to identify its competitors and estimate their sales.
Information needed to do so can be obtained from industry trade associations, which often collect and publish total industry sales. This estimation enables a company to evaluate its performance against the industry as a whole.
Suppose the company’s sales are increasing at a rate of 4 percent a year, and industry sales are increasing at 9 percent. This implies that this company is actually losing its relative position in the industry.
Data for estimating sales can also be obtained from marketing research firms. These firms compile reports on total sales and brand sales and offer them for sale.
A company can buy data from marketing research firms on total product category sales as well as brand sales. By analyzing these data, the company can evaluate its performance against that of the total industry or any particular competitor to determine whether its relative position is improving or deteriorating.
Demand States and Marketing Tasks
Marketing managers encounter different demand states in the market, and they need to address them effectively. Let’s explore each demand state and the corresponding marketing tasks.
Negative Demand
If a major portion of the market dislikes the product and is willing to pay the price to avoid it, it is known as negative demand.
Many people may not like being vaccinated to remain safe from certain diseases, or females may not be ready to use “Copper T” as birth control. What should a marketing manager do if his product faces such a situation?
He should try to find the reason(s) for this. Once the reason(s) is/are identified, actions may be taken on product modification, price change, distribution network modification, or even promotional policy.
No Demand
If customers are not informed of or are uninterested in the product, this is known as a no-demand situation.
Housewives, for example, may not be interested in a new type of complicated iron. If a product faces a no-demand situation, the marketing manager should try to find out the inconsistencies in his product with that of customers’ needs.
Thereafter, ways should be sought to modify the product to make it more user-friendly with the hope of creating interest in the customers.
Latent Demand
Consumers have numerous needs – some of them are expressed, while others are not. It may so happen that the products available in the marketplace cannot reasonably satisfy some of their needs.
For example, there could be a latent demand for contraceptives without any side effects. If such a situation prevails, it can be termed as a latent demand situation.
Here, the marketing manager should first calculate the size of the potential market and thereafter try to develop products that can better meet such a need felt by the customers.
Declining Demand
Declining demand is when a company’s product sales start falling. All companies usually face such a situation, but the time may vary. For example, jute goods manufacturers here in Bangladesh are facing this problem.
The consequent marketing task is to analyze the causes of market decline and determine whether demand can be restimulated by finding new target markets, changing the product’s features, or developing more effective communication.
Irregular Demand
Demands for certain products and services vary seasonal, daily, or even hourly. It may cause problems of idle or overworked capacity. One of the examples is the transportation business, where much of the equipment remains idle during off-peak hours.
On the other hand, they are found to be insufficient during peak hours of the day. Dhaka Children’s Park, for example, is under-visited on weekdays, whereas it is found to be overcrowded on holidays. In such a situation, a marketer should undertake synchro marketing activities.
Here, companies try to find ways to alter the same demand pattern through flexible pricing, promotion, and other incentives.
Full Demand
When companies are highly satisfied with their volume of business, it is known as a full-demand situation. In such a situation, a marketer should try to maintain the current level of demand in the face of changing consumer preferences and increasing competition.
A company can ensure this by improving the quality of its products and continually measuring consumer satisfaction to ensure that it is doing a good job from the consumers’ point of view.
Overfull Demand
If a company faces a higher demand level than it can or wants to handle, it is known as an overfull demand situation. Sangsad Bhaban Plaza, for example, is overcrowded in winter afternoons or summer evenings. Such a situation calls for demarketing activities.
Here, companies find ways to reduce the demand temporarily or permanently. Demarketing consists of such steps as raising prices and reducing promotion and service. It may also consist of reducing the demand from those parts of the market that are less profitable or less in need of the product.
Unwholesome Demand
Certain products are either discouraged by religion or society, known as unwholesome products.
Some products falling in this category are cigarettes, alcohol, hard drugs, handguns, X-rated movies, pirated copies of the software, and, in the Indian context, movies available in video tapes and VCDs.
Organizations engaged in campaigns against consuming such products should get people who like something to give it up, using such tools as fear messages, price hikes, and reduced availability.
Once you understand the states of demand, you may be willing to know how marketers manage the demand situations they face. They can manage demand through marketing research, planning, implementation, and control.
A good marketing plan calls for decisions on target markets, market positioning, product development, pricing, distribution channels, physical distribution, communication, and promotion. We shall analyze all these marketing tasks in subsequent lessons.