The word equilibrium is derived from the Latin word ‘aequilibrium,’ which means equal balance. Prof. Stigler defines equilibrium in his sense in these words, “equilibrium is a position from which there is no net tendency to move.”
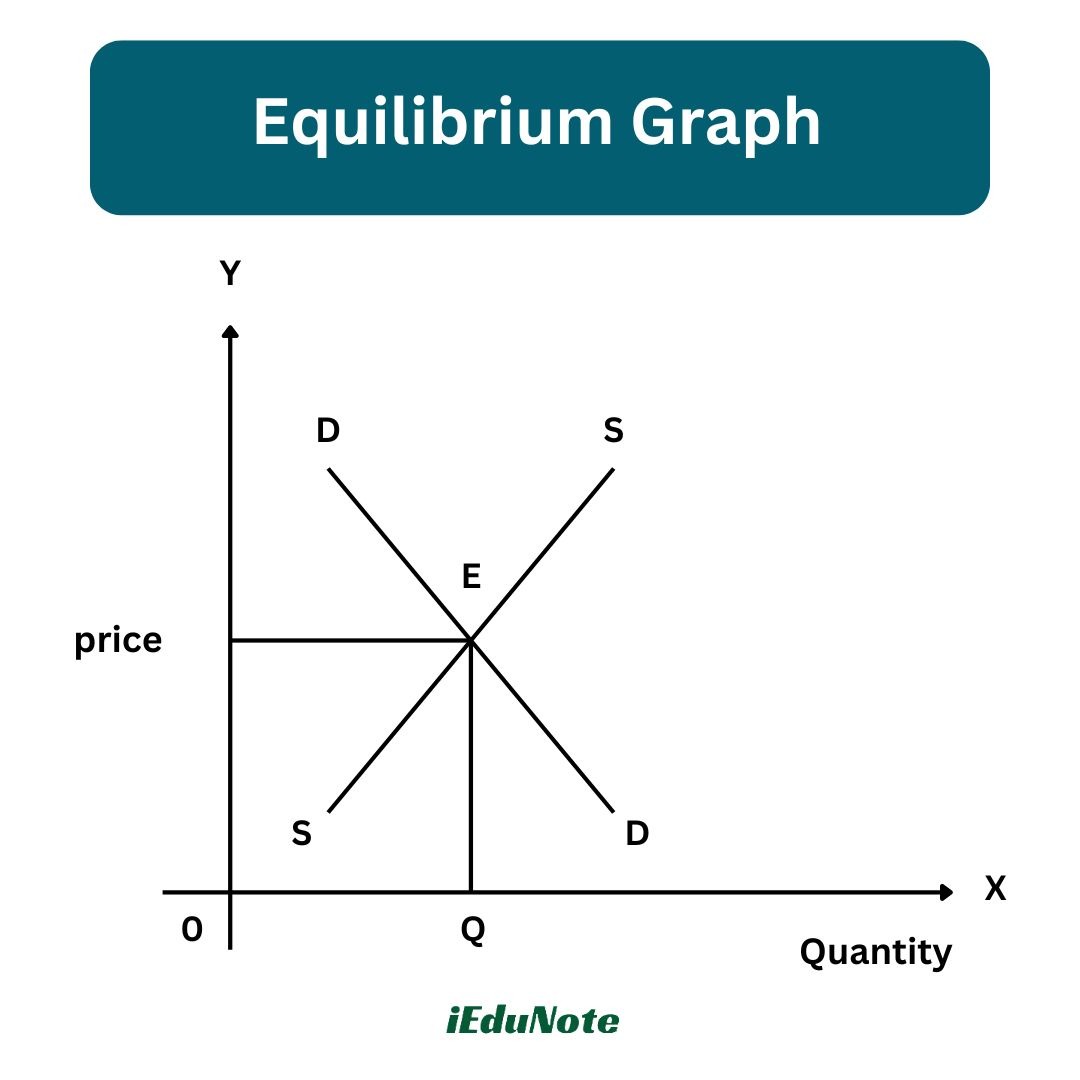
Market equilibrium, for example, refers to a condition where a market price is established through competition such that the amount of goods or services bought by buyers is equal to the amount of goods or services produced by sellers.
It is the point at which the quantity demanded and quantities supplied are equal.
This price is often called the equilibrium price or market clearing price and will tend not to change unless demand or supply changes.

The above diagram shows DD and SS, the demand and supply curves respectively. They intersect at point E where quantities of demand and supply equal OQ at price OP.
Generally, economists are interested in the equilibrium values of the variables attained as a result of the adjustment of the given variables to each other.
That is why economic theory has sometimes been called equilibrium analysis.
Concepts of Equilibrium:
Partial Equilibrium
Partial equilibrium analysis is the analysis of an equilibrium position for a sector of the economy or one or several partial groups of the economic unit corresponding to a particular set of data.
Partial or particular equilibrium analysis, also known as microeconomic analysis, is the study of the equilibrium position of an individual, a firm, an industry, or a group of industries viewed in isolation.
In other words, this method considers the changes in one or two variables while keeping all others constant, i.e., ceteris paribus (others remaining the same).
For Example:
(a) Consumer’s Equilibrium: With the application of partial equilibrium analysis, a consumer’s equilibrium is indicated when he is getting maximum aggregate satisfaction from a given expenditure and in a given set of conditions relating to the price and supply of the commodity. The conditions are:
- The marginal utility of each good is equal to its price (P), i.e., MUA/PA = MUB/PB = MUN/PN, and
- The consumer must spend his entire income (Y) on the purchase of goods, i.e., Y = PAQA + PBQB + … + PNQN. It is assumed that his tastes, preferences, money income, and the prices of the goods he wants to buy are given and constant.
(b) Producer’s Equilibrium: A producer is in equilibrium when he can maximize his aggregate net profit in the economic conditions in which he is working.
(c) Firm’s Equilibrium: A firm is said to be in long-run equilibrium when it has attained the optimum size that is ideal from the viewpoint of profit and utilization of resources at its disposal.
(d) Industry’s Equilibrium: The equilibrium of an industry shows that there is no incentive for new firms to enter it or for the existing firms to leave it. This will happen when the marginal firm in the industry is making only normal profit, neither more nor less. In all these cases, those who have an incentive to change it have no opportunity, and those who have the opportunity have no incentive.
Three Types of Equilibrium

General Equilibrium
The concept of general equilibrium was first explained by Leon Walras (1834-1910), a neoclassical economist, in his book ‘Elements of Pure Economics’.
According to him, general equilibrium is the cumulative effect of both the effects of demand and supply-side forces in the whole economy.
General equilibrium theory is a branch of theoretical microeconomics. Partial equilibrium analysis studies the relationship between only a selected few variables, keeping others unchanged.
Whereas general equilibrium analysis enables us to study the behavior of economic variables taking full account of the interaction between those variables and the rest of the economy.
In partial equilibrium analysis, the determination of the price of a good is simplified by just looking at the price of one good and assuming that the prices of all other goods remain constant.
Thus, the economy is in general equilibrium when commodity prices make each demand equal to its supply, and factor prices make the demand for each factor equal to its supply so that all product markets and factor markets are simultaneously in equilibrium.
Such a general equilibrium is characterized by two conditions in which the set of prices in all product and factor markets is such that:
- 1. All consumers maximize their satisfaction, and all producers maximize their profits, and
- 2. All markets are cleared, which means that the total amount demanded equals the total amount supplied at a positive price in both the product and factor markets.
Neutral Equilibrium
Neutral equilibrium is when the disturbing forces neither bring it back to the original position nor do they drive it further away from it. It rests where it has been moved.
When an initial equilibrium position is disturbed, the forces of disturbance bring it to the new position of equilibrium where the system has come to rest.
According to Prof. Pigou, “An egg lying on its side is in neutral equilibrium.” The neutral equilibrium condition is illustrated in the figure below.
Here, the initial equilibrium point is related to where OQ quantity is demanded and supplied at OP price. With the rise in the price to OPi, the equilibrium point shifts to a new position but the quantity demanded and supplied remain the same, i.e., OQ. Thus, the price range PPi represents neutral equilibrium.
Dynamic Equilibrium
The word dynamic means causing to move. In economics, ‘dynamic’ refers to the study of economic change. When after a fixed period the equilibrium state is disturbed, it is called dynamic equilibrium.
In dynamic equilibrium, prices, quantities, incomes, tastes, technology, etc., are constantly changing.
For example, suppose some more persons develop a taste for fish; as a result, the demand for fish will increase. Sellers will at once raise the price and thus change the behavior of the old buyers.
The market will be thrown into a state of disequilibrium and will remain so until the supply of fish is increased to the level of the new demand. Economics is thus a process of change through time.
Dynamic equilibrium is of two types:
Micro Dynamic Equilibrium
It is used to explain the dynamics of demand, supply, and price over a long period of time. As prices move up and down in cycles, quantities produced also seem to move up and down in a counter-cyclical manner (e.g. prices of perishable commodities like vegetables).
Macro Dynamic Equilibrium
According to Kurihara, ‘Macro-Dynamics’ treats discrete movements or rates of change of macro-variables. It can be explained in terms of the Keynesian process of income propagation (the investment multiplier) where consumption depends on income, i.e., C = f(Yt-1).
Where: C = Consumption Y = Income f = function
The function shows that the consumption in the current period (t) depends on the Y in the previous period (t-1).
On the other hand, investment is a function of time and of constant autonomous investment Al (Autonomous investment is the investment which does not change due to changes in income, i.e., changes in investment do not take place due to changes in income).
For example, the government does the investment for the welfare of the people and not for profit expectation. So the investment function can be written as I = f(AI).