The curve that shows the inverse relationship between unemployment and the money wage rate is called the Philips curve. WH Philips is the father or initiator of this concept. And it is according to his name.
WH Philips at the last portion of the 50th decade wrote in his essay that “If any anti-inflationary step is taken then inflation decreases but money wage rate increases.
Because if unemployment is reduced then demand for labor in the labor market increases and there creates a shortage in the supply of labor.”
Therefore, Philip shows the relationship between unemployment and inflation. According to Philip, if unemployment decreases then the rate of inflation increases and if unemployment increases then the rate of inflation decreases.
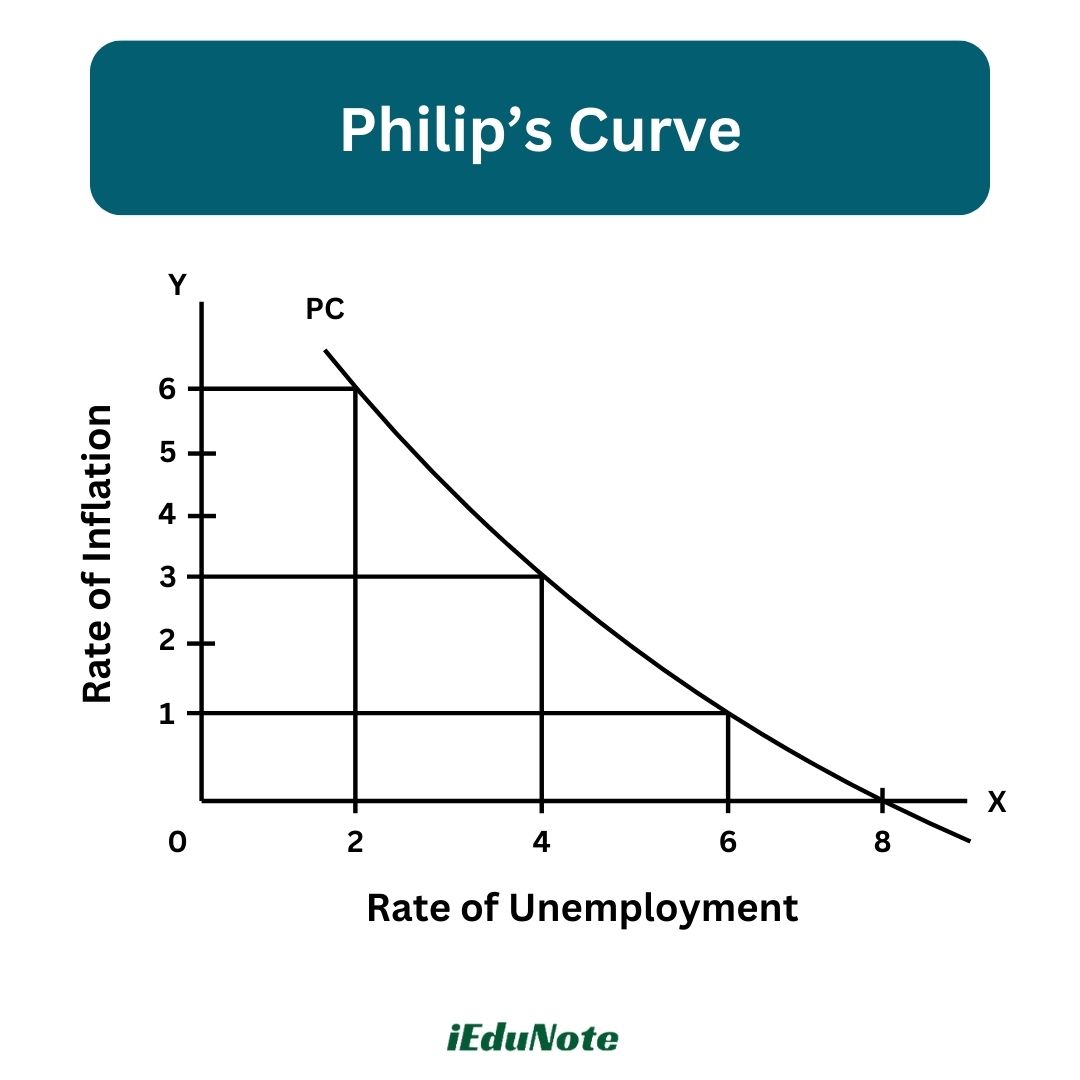
In the above figure, the rate of unemployment indicates the OX axis, and the rate of inflation indicates the OY axis. If the rate of unemployment is 8%, then inflation is zero.
If the unemployment rate is reduced to 6%, 4%, or 2%, then the rate of inflation rises to 1%, 3%, and 6%, respectively.
That is why an inverse relationship between unemployment and the rate of inflation is observed here.
Difference between short-run and long-run Philips curve

In the short run, the Philips curve shows an inverse relationship between unemployment and the rate of inflation.
But in the long run, the Philips curve shows the variation of the inflation rate at a particular stage of unemployment.
Here are the differences between the short-run and long-run Philips curves:
- The short-run Philips curve slopes from left to downward to the right. On the other hand, the long-run Philips curve is parallel to the vertical axis.
- The short-run Philips curve is related to imperfect competition in the economy. Consequently, there are opportunities for newly increased investment, employment, production, and decreasing unemployment. But the long-run Philips curve is adjustable with normal unemployment situations at full employment, where there is no chance of increasing production, investment, employment with rises in prices. Therefore, unemployment does not decrease here.
- In the short-run Philips curve, there is a provision of a tradeoff between inflation and unemployment. But in the long-run Philips curve, no tradeoff between inflation and unemployment is possible.
- The short-run Philips curve can play a role in determining the tolerable region of inflation and unemployment. But in the case of the long-run Philips curve, it cannot play any role.
- The short-run Philips curve can play a role in policy making. But the long-run Philips curve cannot play any role in policy making.
Significance of Philips curve

The significance of the Philips curve has drawn the attention of economic policy makers. It is explained through the light of macroeconomic analysis:
- The Philips curve is an important invention for the macroeconomic analysis of economic problems. This curve has made it possible to show the relationship between two economic problems like inflation and unemployment.
- The Philips curve may indicate the tradeoff between inflation and unemployment. Both inflation and excessive unemployment are unwanted in economics. Therefore, measures against both are a must (through monetary policy and fiscal policy). But through knowledge of the Philips curve, we know that anti-measures against inflation create unemployment, and inversely, measures against unemployment create rising prices or inflation. That is, to escape from inflation, we have to accept the burden of unemployment. Inversely, to have a lightening of the burden of unemployment, we have to suffer from price rises or inflation. That is why the policymakers have to decide which combination of inflation and unemployment we are willing to bear to minimize economic loss. This give-and-take policy to bring the problem into a tolerable region is termed the tradeoff Philips curve.
- The Philips curve provides guidance to policy makers. In an economy, it is not possible to achieve zero unemployment or zero inflation. Therefore, both inflation and unemployment need to be kept within a tolerable combination. For this, the Philips curve plays a vital role in reaching the optimum combination.
- In any economy, a stop-and-go policy realization can be possible through the Philips curve. If the government takes inflationary measures, then unemployment is observed, and people become conscious of unemployment. Then the government takes anti-unemployment measures and stops the action against inflation. Thus, the government has to follow a stop-and-go policy to address the dual problem of inflationary pressure and unemployment. In facing this dual problem, the Philips curve can provide appropriate guidance to government policy makers through the application of a stop-and-go policy.
- The Philips curve can establish a relationship between money wage and unemployment. It can help the pay commission in providing a probable new pay scale and thus facing the problem of inflation or unemployment.
Determination of the tolerable region of inflation and unemployment
The rate of inflation and unemployment that do not create obstacles in normal economic activities are termed as the tolerable rate of inflation and unemployment. Excessive inflation as well as excessive unemployment are both unwanted.
Moreover, the rate of inflation cannot be reduced to zero, and the rate of unemployment cannot be reduced to zero.
Therefore, both inflation and unemployment should not be allowed to exceed a certain stage. The policy makers are responsible for deciding to what extent inflation and unemployment are tolerable.
In other words, a tolerable combination of inflation and unemployment is to be selected by the policy makers, and it is their major responsibility.
The rate of inflation and unemployment that society can bear is called the tolerable rate of inflation and unemployment. Through the Philips curve, inflation and unemployment can be determined.
The major responsibilities of policy makers are to bring down the rate of inflation and unemployment within the tolerable region through the application of monetary and fiscal tools and equipment.
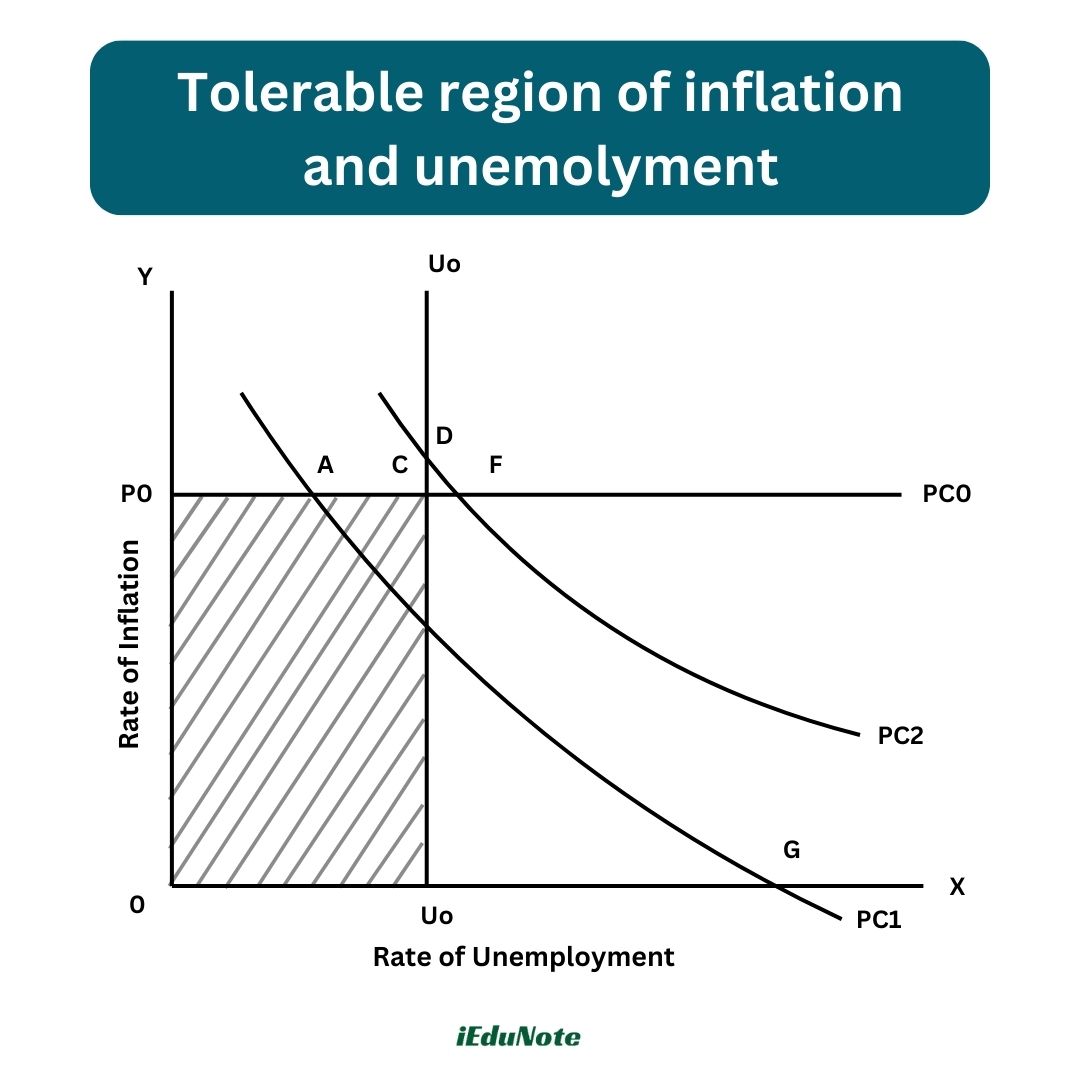
In the figure, OX axis and OY axis indicate the rate of unemployment (%) and the rate of inflation (%) respectively. Uo is the highest tolerable inflation. OPoCUo is the tolerable zone. The point C is the highest level of inflation and the highest level of unemployment.
Here we consider that PCi is a Philips curve. Moreover, we consider that outside the tolerable region, G is a point where unemployment is prevailing.
In these situations, extensive monetary policy and fiscal policy may be adopted in order to make inflation tolerable. Point O, as well as unemployment, can be minimized.
On the other hand, if inflation is at point F, which is situated outside the tolerable region, the construction of fiscal and monetary policy may be adopted in order to minimize the unemployment rate to the Uo level.
That means if the Philips curve is situated to the left of point C, then both monetary and fiscal policies can be successfully adopted.
If the Philips curve is situated to the right of point C or if it is PC2, then it may create a policy dilemma. That is, although the inflation is within the tolerable range, unemployment at point U exceeds the tolerable area.
On the other hand, at point D, although unemployment is within the tolerable rate, inflation exceeds the tolerable region. Moreover, at both points, it exceeds the tolerable area.
Therefore, whether the policy of fiscal measures or monetary measures will be successful or not depends on whether the Philips curve is within or outside the tolerable region.